
The Great Freight Recession squeezed U.S. trucking companies through falling shipment volumes, excess capacity, and rising operating costs. This statistics resource covers the downturn’s timeline, freight rates, business closures, employment, regional conditions, and recovery forecasts.
Data extends through October 16, 2026, where available. Forecasts, monthly benchmarks, and calculations are identified separately from historical annual figures.
Great Freight Recession Statistics (Editor’s Picks)
- Cass shipments recorded 42 consecutive months of annual declines before August 2026.
- U.S. trucking revenue fell 9.8% to $906 billion in 2024.
- U.S. Class 8 truck sales declined 13.4% in 2025.
- Average trucking operating costs reached $2.336 per mile in 2025.
- Truckload carriers averaged a −2.3% operating margin in ATRI’s 2024 sample.
Great Freight Recession Timeline and Historical Statistics

Freight Market Conditions Before the 2022 Downturn
National spot rates reached $3.00 per mile for dry van, $3.47 for refrigerated freight, and $3.08 for flatbed in December 2021. Van and reefer monthly averages set records at the time.
The tender rejection index ended 2021 at 22.45%, reflecting limited available capacity before the downturn commonly dated to March–April 2022.
Great Freight Recession Statistics by Year (2022–2026)

| Year | Cass shipment change | Market context |
| 2022 | +0.6% annually | Spot pricing weakened after early-year highs |
| 2023 | −5.5% annually | ATA for-hire tonnage fell 1.7% |
| 2024 | −4.1% annually | Truck tonnage totaled 11.27 billion tons |
| 2025 | −6.1% annually | ATA tonnage was approximately flat |
| 2026 | +1.9% in September, year over year | Full-year results unavailable |
Cass shipments and ATA tonnage measure different freight populations and units. Their growth rates should not be treated as interchangeable.
Duration of the Freight Recession Compared With Previous Downturns
The Cass annual shipment-decline streak ended in August 2026. Separately, dry-van contract linehaul maintained a premium over spot pricing for roughly 45 months, from March 2022 through November 2025.
For comparison, contemporary reporting described approximately nine difficult months before truckload conditions stabilized in 2019. Early-2009 commentary described freight recession conditions lasting nearly three years.
These durations use different indicators rather than a standardized recession-dating method.
Freight Market Peak-to-Trough Decline
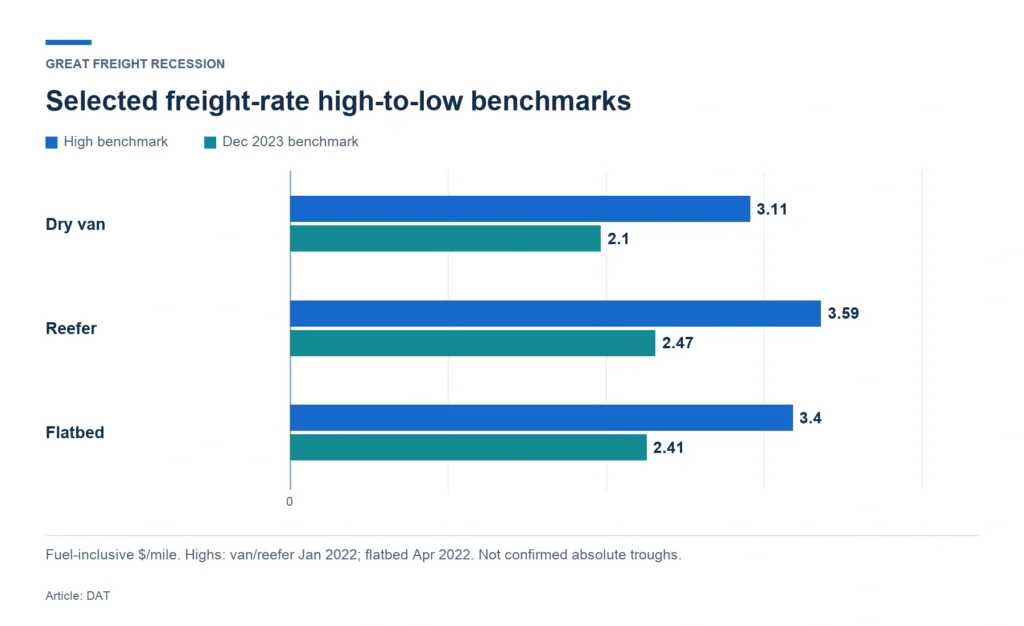
Selected DAT high-to-low benchmarks show substantial rate declines:
| Equipment | High benchmark | Later low benchmark | Calculated decline |
| Dry van | $3.11, January 2022 | $2.10, December 2023 | 32.5% |
| Reefer | $3.59, January 2022 | $2.47, December 2023 | 31.2% |
| Flatbed | $3.40, April 2022 | $2.41, December 2023 | 29.1% |
Figures are fuel-inclusive dollars per mile. These are documented comparison points, not confirmed absolute troughs across every monthly observation.
Freight Recession Recovery Timeline
September 2024 brought the first simultaneous annual increases in DAT’s three major spot linehaul categories since March 2022.
Pricing improved before shipments. Cass recorded another cycle low in January 2026, then positive annual shipment growth in August and September. The sequence indicates that rate recovery preceded a broader volume recovery.
Sources: DAT, Cass, DAT, FL, TB&P, TN, Arrive.
Freight Volume and Shipment Statistics

Annual Freight Shipment Volume Changes
Trucks moved 11.27 billion tons of domestic freight in 2024, down from 11.41 billion in 2023. The reduction totaled approximately 140 million tons, or 1.2%.
Trucking accounted for 72.7% of domestic freight by weight. This annual tonnage estimate measures freight weight rather than the number of shipments.
Year-over-Year Freight Volume Growth and Decline
Cass shipments fell 9.3% year over year in August 2025 and 7.5% in December.
September 2026’s positive annual reading still left shipments 3.6% below September 2024. Growth against a depressed prior-year comparison therefore did not represent a return to earlier volume levels.
Truckload Freight Demand Statistics

DAT’s 2025 contract load index declined 1.8%, while spot load postings increased 26.3%. In the fourth quarter, contract loads fell 3.6% and spot postings rose 33.5%.
Load postings measure marketplace activity, not completed shipments. Their increase should not be interpreted as equivalent growth in freight moved.
Freight Tender Volumes and Rejection Rates

| Period | Tender rejection rate |
| September 2022 | 5.18% |
| 2023–2025 typical conditions | Generally below 5% |
| February 2026 cited reading | 13.40% |
From October 2023 to October 2026, SONAR’s rejection index increased 268%, while tender volume increased about 9%. Capacity tightening substantially outpaced demand growth.
Freight Shipment Trends by Quarter
ATA tonnage fell 1.8% sequentially and 0.3% annually in Q4 2025. In Q1 2026, tonnage increased 2.1% year over year.
Recovery remained uneven in Q3 2026: DAT’s September volume indexes were down 1% for van, 10% for reefer, and 7% for flatbed versus a year earlier.
Sources: ATA, Cass, AFFI, FW, ATA, DAT.
Freight Rate Statistics During the Great Freight Recession

Average Trucking Spot Rates by Year
The research does not provide comparable annual averages for every equipment category. The following figures are monthly benchmarks, not annual averages.
| Benchmark | Dry van | Reefer | Flatbed |
| December 2022 | $2.41 | $2.82 | $2.77 |
| March 2023 | $2.16 | $2.50 | $2.71 |
| March 2025* | $1.99 | $2.27 | $2.53 |
| March 2026 | $2.52 | $2.97 | $3.09 |
All figures include fuel and are per mile. March 2025 values are calculated from DAT’s March 2026 figures and reported annual dollar increases. Comparable fuel-inclusive 2024 observations were not supplied.
Contract Freight Rate Changes
Dry-van contract rates fell from $3.09 per mile in October 2022 to $2.75 in March 2023 and $2.49 in December 2023.
On a separate, fuel-excluded basis, dry-van contract linehaul averaged $2.81 in 2022, $2.32 in both 2024 and 2025, and $2.69 in Q3 2026.
Dry Van, Reefer, and Flatbed Rate Comparisons
| September 2026 rate per mile | Dry van | Reefer | Flatbed |
| Spot, including fuel | $3.01 | $3.62 | $3.61 |
| Spot linehaul, excluding fuel | $2.17 | $2.70 | $2.60 |
| Contract, including fuel | $3.24 | $3.58 | $4.04 |
Reefer recorded the highest spot rate, while flatbed recorded the highest contract rate.
Freight Rates per Mile Before and During the Recession
By April 2022, dry-van spot pricing had fallen to $2.77 per mile and reefer to $3.13. Flatbed remained at $3.40, illustrating different equipment-market turning points.
In September 2024, fuel-excluded spot linehaul averaged $1.59 for van, $1.95 for reefer, and $1.92 for flatbed. These figures cannot be compared directly with fuel-inclusive rates.
Spot-to-Contract Rate Spreads

In October 2022, contract premiums over spot rates were $0.66 per mile for van, $0.57 for reefer, and $0.74 for flatbed.
By June 2026, spot rates exceeded contract by $0.11 for van and $0.17 for reefer. Flatbed contracts retained an $0.11 premium.
Sources: DAT, DAT, DAT, FW, DAT, LM, FL.
Trucking Industry Capacity Statistics

Active Trucking Companies and Operating Authorities
The supplied research reports 339,220 for-hire carriers with operating authority in 2024, compared with 352,220 in 2023.
A much broader FMCSA registration measure listed 2,132,868 carriers on May 15, 2026. Registered carriers, active for-hire authorities, and individual trucks represent different populations.
Trucking Company Entries and Exits by Year
FTR/FMCSA-based analysis reported approximately 40,000 carrier exits in 2023 and 19,000 in 2024.
Through August 7, 2026, reporting identified 19,594 revocations alongside more than 5,000 net authority additions. Grants and reinstatements offset losses; a registration-system backlog also affected timing.
Truck-to-Load Ratio Statistics
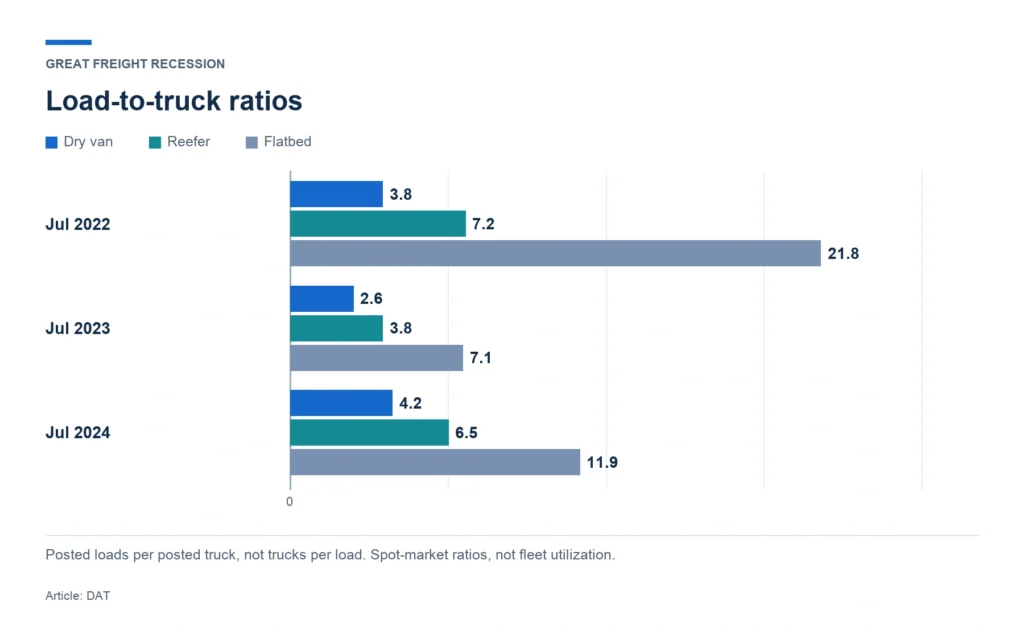
DAT publishes load-to-truck ratios: posted loads per posted truck, rather than trucks per load.
| Period | Dry van | Reefer | Flatbed |
| July 2022 | 3.8 | 7.2 | 21.8 |
| July 2023 | 2.6 | 3.8 | 7.1 |
| July 2024 | 4.2 | 6.5 | 11.9 |
These marketplace ratios indicate spot-market balance, not utilization across the entire U.S. fleet.
Class 8 Truck Sales and Fleet Capacity Changes
| Year | U.S. Class 8 retail sales |
| 2023 | 271,607 |
| 2024 | 240,249 |
| 2025 | 208,155 |
Sales measure equipment purchases. They do not show net fleet expansion because purchases can replace existing trucks.
For-Hire Trucking vs. Private Fleet Capacity
Surveyed private fleets handled 75% of outbound freight in 2023, versus approximately 67% before COVID-19.
Their own freight hauled increased 7% in 2024, while inbound share reached 43%. Private-fleet expansion helped explain why for-hire demand remained weak despite continued goods movement.
Sources: FMCSA, Ryan, FW, DAT, DAT, SEC, NADA, CCJ.
Freight Recession Bankruptcies and Business Closures
Trucking Company Bankruptcies by Year
The research does not establish complete annual trucking bankruptcy totals for 2022–2026.
For 2025, it identifies at least 20 freight/trucking filings in Q2, 21 in Q3, and 18 during October–November. These partial-period counts must not be presented as a full-year total.
Motor Carrier Authority Revocations and Business Exits
November 2023 recorded a net loss of 2,087 operating authorities, compared with a pre-cycle monthly loss record of 329 in November 2016.
April 2025 recorded 7,474 business exits, the highest monthly figure in 12 months. Authority losses are administrative events and do not establish court bankruptcy filings.
Freight Broker Closures and Market Exits

A brokerage-authority analysis cited in the research reported approximately 2,395 closures in 2023 and 3,104 in 2024. Active brokerage authorities ended 2024 at 25,334.
These figures describe authority changes. They should not be interpreted as counts of bankrupt freight brokers.
Small Trucking Company vs. Large Carrier Failure Rates
No reliable fleet-size-specific failure rate appears in the supplied research.
An authority-exit analysis found that 61% of exits since September 2023 involved operators active for less than three years. Another 26% involved carriers operating for more than five years. Business age does not establish fleet size.
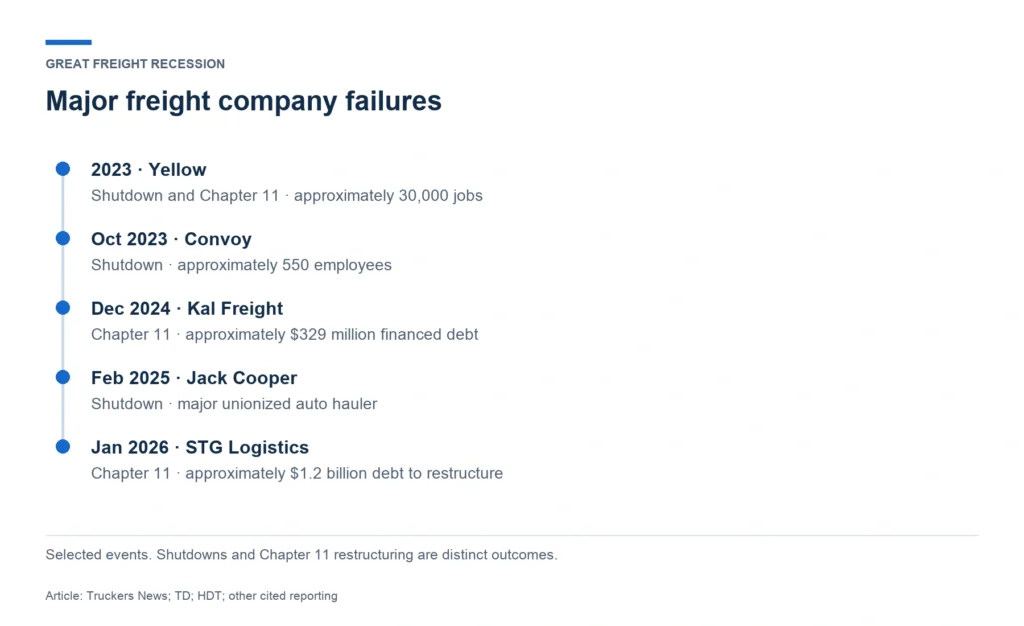
Major Freight Company Bankruptcies and Shutdowns
| Company | Event | Reported scale |
| Yellow | Shutdown and Chapter 11, 2023 | Approximately 30,000 jobs |
| Convoy | Shutdown, October 2023 | Approximately 550 employees |
| Kal Freight | Chapter 11, December 2024 | Approximately $329 million in financed debt |
| Jack Cooper | Shutdown, February 2025 | Major unionized auto hauler |
| STG Logistics | Chapter 11, January 2026 | Approximately $1.2 billion in debt to restructure |
Shutdown, liquidation, and Chapter 11 restructuring are distinct outcomes. Company-specific debt, customer losses, and operating problems also contributed to failures.
Sources: EFN, FW, FW, LinkedIn, Ryder, Truckers News, TD, HDT.
Freight Recession Financial Impact Statistics

Trucking Industry Revenue Changes
U.S. trucking revenue dropped by $98 billion between 2023 and 2024, from $1.004 trillion to $906 billion.
Company results varied in 2025: J.B. Hunt revenue declined 0.7%, while Saia revenue increased 0.8%. Individual companies did not experience the downturn uniformly.
Operating Profit Margins Among Publicly Traded Carriers
| Carrier or segment | Period | Operating margin |
| Saia | FY2025 | 10.9% |
| J.B. Hunt, consolidated | FY2025 | 7.2% |
| Knight-Swift, truckload | FY2025 | 3.0% |
| Werner, truckload | Q1 2025 | −0.2% |
Margins equal 100% minus operating ratio. Consolidated companies and individual segments are not directly equivalent comparisons.
Trucking Operating Costs per Mile
Average operating costs increased from $2.260 per mile in 2024 to $2.336 in 2025.
Excluding fuel, costs rose from $1.779 to $1.854 per mile, a 4.2% increase. Non-fuel expenses therefore increased faster than total operating costs.
Fuel, Insurance, Maintenance, and Labor Cost Trends
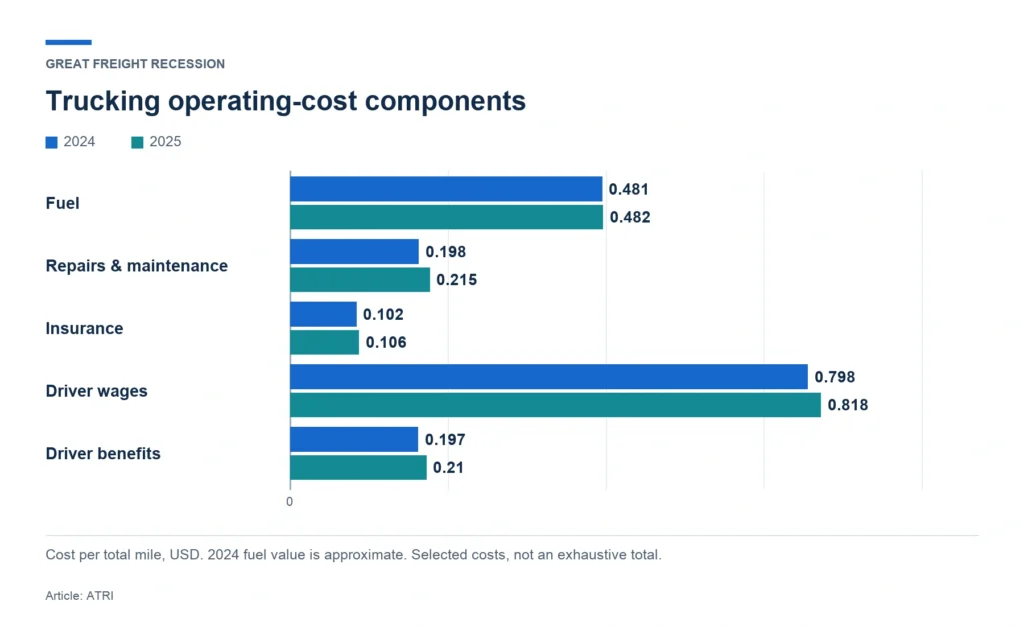
| Cost per mile | 2024 | 2025 |
| Fuel | Approximately $0.481 | $0.482 |
| Repairs and maintenance | $0.198 | $0.215 |
| Insurance | $0.102 | $0.106 |
| Driver wages | $0.798 | $0.818 |
| Driver benefits | $0.197 | $0.210 |
Driver wages and benefits together exceeded $1 per mile in 2025.
Freight Carrier Profitability and Break-Even Rates
ATRI reported 16.7% empty miles in 2024. Combining that figure with $2.260 in operating costs per total mile implies approximately $2.71 in required revenue per loaded mile.
This calculation assumes loaded miles recover all operating costs. It excludes profit and is an illustrative benchmark, not a universal carrier break-even rate.
Sources: ATA, JBHT, Saia, StockTitan, Werner, FW, ATRI.
Freight Recession Employment Statistics
Trucking Industry Employment Changes by Year
| Period | Reported truck-transportation employment change |
| 2023 | More than 50,000 jobs lost |
| 2024 | Approximately 41,000 lost |
| 2025 | Approximately 26,000–28,000 lost |
| January–September 2026 | Approximately 10,500 gained |
Revised data show a deeper employment correction than earlier preliminary releases.
Truck Driver Layoffs and Job Losses
Truck-transportation payrolls reached approximately 1.473 million in September 2026, still about 115,000 below the January 2023 peak.
This industry series includes non-driving employees and excludes drivers employed in other industries. It is not a direct count of truck-driver layoffs.
Truck Driver Wage and Earnings Trends
Heavy and tractor-trailer drivers earned a median $58,640 annually, or $28.19 hourly, in May 2025.
For drivers employed specifically in truck transportation, the median was $60,320 annually. These occupational wage measures differ from average earnings across all trucking-industry employees.
Freight Brokerage and Logistics Employment
C.H. Robinson’s reported workforce declined from approximately 14,990 in Q1 2024 to 12,085 in Q4 2025, a 19.4% reduction.
Management linked reductions primarily to automation and productivity. The full decline should not be attributed to the freight recession.
Trucking Job Openings and Hiring Trends
BLS projects 214,500 annual openings for heavy and tractor-trailer drivers during 2025–2035. Most represent replacement needs rather than newly created jobs.
For logisticians, BLS projects 26,600 annual openings over the same period.
Sources: BLS, Land Line, BLS, Yahoo Finance, BLS.
Freight Recession Statistics by U.S. Region
Northeast Freight Market Statistics
Northeast shipments increased 12.1% year over year in Q4 2025, while freight spending rose 16.7%.
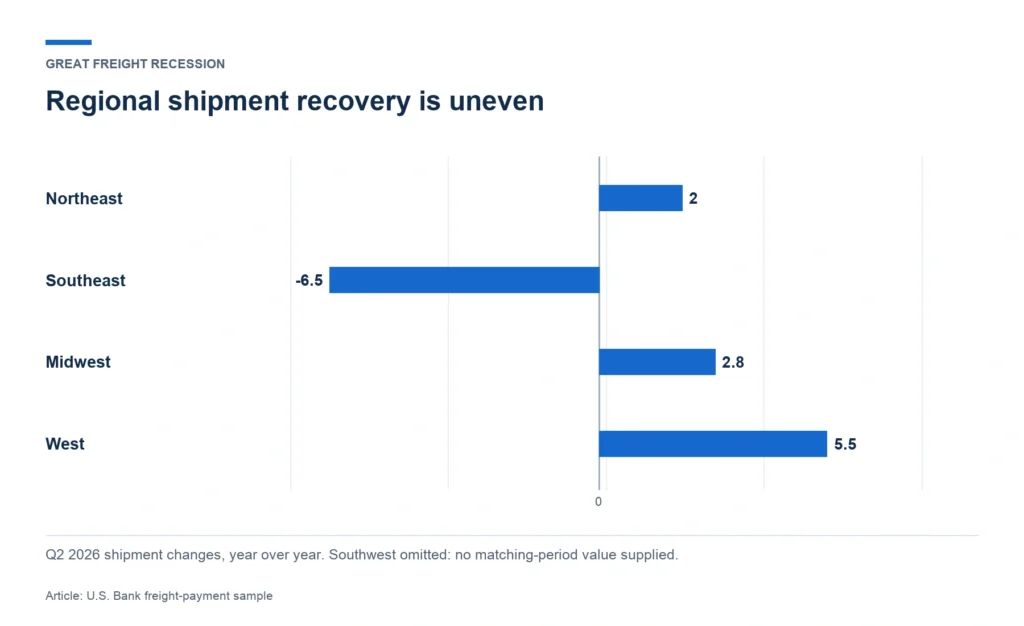
By Q2 2026, shipments were 2.0% above the prior year but unchanged sequentially. U.S. Bank’s regional figures reflect its freight-payment transaction sample.
Southeast Freight Market Statistics
Southeast shipments fell 5.9% year over year in Q4 2025.
Q2 2026 produced a 0.9% sequential increase, the first in three quarters. However, shipment volume remained 6.5% below the prior year.
Midwest Freight Market Statistics
Midwest shipments rebounded 3.5% sequentially in Q4 2025 but remained 3.3% below the prior year.
In Q2 2026, shipments fell 3.7% sequentially while increasing 2.8% annually. The two comparisons describe different reference periods.
Southern and South Central Freight Market Statistics
U.S. Bank’s Southwest region provides the closest supplied regional benchmark, rather than an exact match for all Southern and South Central states.
Southwest shipments rose 6.7% sequentially in Q2 2025 but remained 26% below the prior year. The annual decline was still 25.4% in Q4.
Western U.S. Freight Market Statistics
Western shipments increased 3.2% on an annual-average basis in 2025, following declines exceeding 16% in both 2023 and 2024.
Q2 2026 shipments increased 5.5% year over year, the strongest annual result among the regions reported in the supplied release.
Freight Recession Impact by Industry

Retail and E-Commerce Freight Demand
Real retail sales increased 2.1% year over year in May 2026. Nonstore retail sales increased 1.5% month over month in the cited economic update.
Retail sales indicate potential freight demand but do not measure truck shipments directly.
Manufacturing and Industrial Freight Volumes
The ISM Manufacturing PMI registered 48.2 in November 2025, its ninth consecutive month below the 50 expansion threshold.
New orders stood at 47.4 and backlogs at 44.0, indicating continued weakness in manufacturing demand.
Construction Materials and Building Products Freight
Housing starts fell 15.4% month over month and 8.7% year over year in May 2026. Multifamily starts declined 41.6% monthly.
C.H. Robinson estimates that each new home generates approximately eight truckloads of freight. This is a planning estimate, not a measured universal ratio.
Automotive Industry Freight Statistics
Motor-vehicle rail carloads declined 4.5% year over year during the four-week period covered in the cited late-2025 Ryder update.
Federal Reserve contacts separately reported slight auto-production growth in August 2025. Production reports and rail traffic measure different parts of automotive activity.
Agriculture, Food, and Beverage Freight Trends
North American rail grain traffic increased 12.9% year over year in the cited June 2026 data. Farm-products and food traffic increased 12.0%.
These rail figures indicate agricultural freight conditions across North America; they are not U.S. refrigerated-trucking volume estimates.
Sources: FTR, Ryder, CHR, Fed.
Freight Market Recovery and Forecast Statistics

Freight Shipment Recovery Indicators
Q2 2026 shipment volume fell 2.8% year over year in the cited U.S. Bank reporting, while freight spending increased 28.1%.
The divergence shows why higher freight spending alone does not establish demand recovery. Shipment counts, tonnage, and pricing need separate interpretation.
Trucking Capacity Reduction and Supply-Demand Rebalancing
ATRI reported a 2.2% fleet capacity reduction in 2024 and an average of 0.93 drivers per truck.
The research cites a further 5.5% reduction in effective carrier capacity in 2025. These supply changes helped support rates despite weak shipment growth.
Freight Rate Recovery Forecasts Through 2027

FTR’s October 2026 outlook projected the following annual spot-rate changes, excluding fuel:
| Equipment | 2026 forecast | 2027 forecast |
| Dry van | +37.6% | +3.2% |
| Reefer | +35.8% | +1.3% |
| Flatbed | +35.3% | +2.3% |
These are forecasts from a specific publication date, not completed annual results.
Trucking Industry Revenue and Employment Projections
ATA projects trucking revenue of $1.46 trillion and truck tonnage of 13.99 billion tons by 2035.
BLS projects heavy and tractor-trailer driver employment to grow 4% during 2025–2035, adding approximately 83,800 jobs. Logisticians are projected to grow 18%, adding 44,900 jobs.
Freight Demand and Market Growth Forecasts Through 2030
The supplied ATA public forecast does not disclose a 2030 point estimate.
A separate commercial forecast projects 5.43% annual growth for U.S. wholesale and retail road-freight lanes and 6.01% for LTL during 2026–2031. These segment forecasts use different market definitions from ATA’s national tonnage and revenue projections.
Sources: FW, ATRI, FW, CCJ, ATA, BLS, BLS, R&M.
Conclusion
A broad recovery requires sustained shipment growth alongside healthier carrier economics. Comparisons should preserve each statistic’s period, geography, and measurement basis, especially when distinguishing rising rates from rising demand.