


According to U.S. Customs data, about 12.88 million commercial trucks entered the U.S. from Canada and Mexico in 2023
That works out to roughly 35,000 trucks per day on average (≈15,000/day from Canada and 20,000/day from Mexico). These figures fully recover pre-pandemic levels. In 2023, about 5.53 million trucks came from Canada and 7.36 million from Mexico
The 2023 totals were ~1% higher than 2022, reflecting modest growth from pandemic lows. To know more interesting statistics about trucks entering the USA, let’s dig deeper into the post.
- Top Picks
- Daily Truck Traffic by U.S. State Borders
- Top Border Crossings by Truck Volume
- Truck Entries by Type of Cargo
- Comparison of Northbound vs. Southbound Truck Traffic
- Monthly Trends in U.S. Truck Entries
- Year-over-Year Growth in Truck Crossings
- Types of Trucks that Enters in the USA
- Conclusion
- Connecting Industry Knowledge with Proven Services
Top Picks
- 12.88 million commercial trucks entered the U.S. in 2023.
- That’s about 35,000 trucks per day (≈15K from Canada, 20K from Mexico).
- 5.53 million trucks came from Canada in 2023.
- 7.36 million trucks came from Mexico in 2023.
- U.S. truck entries grew ~1% from 2022 to 2023.
- Michigan’s Ambassador Bridge & Port Huron handled 2.34 million trucks in 2023.
- Buffalo, NY crossings saw ~0.89 million trucks in 2023.
- Laredo, TX recorded ~3.03 million trucks in 2024 (half of all U.S.–Mexico traffic).
- Detroit, MI handled ~1.56 million trucks in 2023.
- Otay Mesa, CA saw ~1.06 million trucks in 2024.
- Port Huron, MI processed ~0.78 million trucks in 2023.
- Hidalgo, TX processed ~0.71 million trucks in 2023.
- Ysleta (El Paso), TX saw ~0.64 million trucks in 2023.
- Loaded truck containers on the northern border rose +6% in March 2025 vs. March 2024.
- Since 2000: Mexico→U.S. truck entries +62.6%, Canada→U.S. –21.6%.
- 2019–2023: Mexico→U.S. truck entries +14.2%, Canada→U.S. –2.7%.
- December 2023 truck crossings were –1.5% YoY.
- March 2025 truck activity was +9% YoY.
- 2022–2023: Canada→U.S. +0.6%, Mexico→U.S. +1.4%.
- 2023–2024 (top ports): Canada→U.S. –0.5%, Mexico→U.S. +2.8%.
Daily Truck Traffic by U.S. State Borders
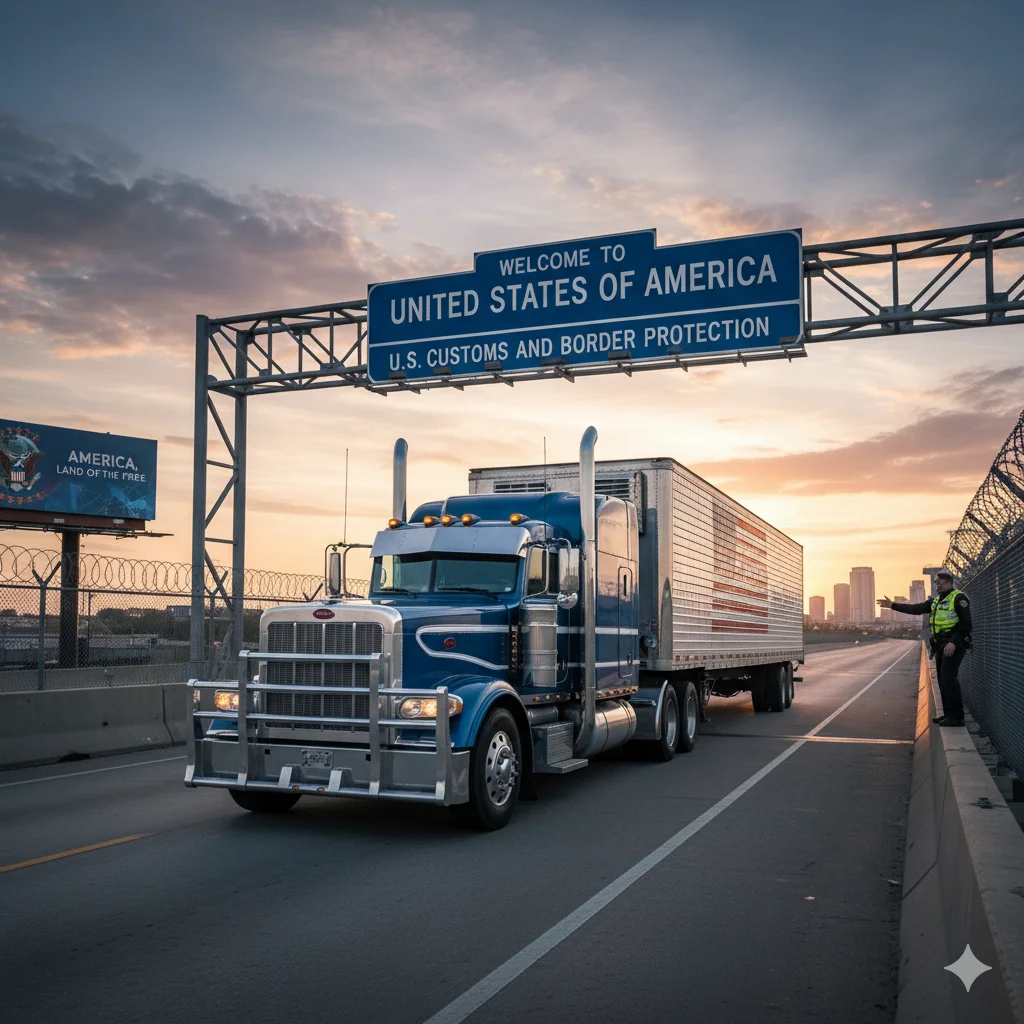
Truck traffic varies greatly by border state. On the northern border, Michigan and New York dominate: for example, Michigan’s Ambassador Bridge and Port Huron ports saw over 2.34 million trucks in 2023, while New York’s Buffalo ports saw ~0.89 million.
On the southern border, Texas is by far the busiest state. The Laredo, Hidalgo and Ysleta (El Paso) ports in Texas together handle well over half of southbound trucks, with Laredo alone seeing ~3.03 million in 2024.
California and Arizona (e.g. Otay Mesa, Calexico, Nogales) handle most of the rest. In short, Michigan/Texas > New York/California > other states.
Source: BTS
Top Border Crossings by Truck Volume
Laredo, TX (Mexico→US): ~3.03 million trucks (2024). Laredo handles roughly half of all U.S.–Mexico truck traffic.
- Detroit, MI (Canada→US): ~1.56 million trucks (2023). Detroit’s Ambassador Bridge accounted for ~36% of U.S.–Canada trucks in 2024.
- Otay Mesa, CA: ~1.06 million trucks (2024). (Major southern California port for Mexico trade.)
- Buffalo-Niagara, NY: ~0.89 million trucks (2023). (Top New York/Canada crossing.)
- Port Huron, MI: ~0.78 million trucks (2023). (Key Michigan/Canada crossing.)
(Other busy ports include Hidalgo, TX (~0.71M in 2023) and Ysleta (El Paso), TX (~0.64M in 2023).) These major ports, driven by high trade flows, account for the bulk of truck entries.
Source: BTS
Truck Entries by Type of Cargo
BTS categorizes truck entries including container traffic. Truck crossings count any freight truck entering the U.S. (no private pickups are counted).
A subset of these, truck container crossings, count each full or empty container on a truck. For example, in March 2025 the number of loaded truck containers crossing the northern border was about 6% higher than a year earlier. (This signals growing containerized trade.)
Data on specific commodities (e.g. vehicles, produce, machinery) require separate TransBorder freight statistics, but key cross-border truck commodities include electronics, vehicles, and machinery.
Sources: BTS, Landline.Media
Comparison of Northbound vs. Southbound Truck Traffic

Trucks entering from the south (from Mexico) have outnumbered those from the north (from Canada) for several years. In 2023, about 7.36 million trucks crossed northbound from Mexico into the U.S., versus 5.53 million southbound from Canada.
This gap has grown over time: since 2000, Mexican‐origin trucks into the U.S. rose ~62.6% while Canadian trucks fell ~21.6%. Likewise, from 2019–2023 truck entries from Mexico increased ~14.2% while those from Canada declined ~2.7%.
Monthly Trends in U.S. Truck Entries
Cross‐border truck volumes show strong seasonality. Volumes typically rise in spring/fall and dip in winter holidays. For example, CBP reported that in December 2023 total commercial truck crossings were down about 1.5% year-over-year.
By contrast, March 2025 truck freight activity was roughly 9% higher than March 2024. (Spring months generally see higher traffic than winter.) In general, cross-border trucking tends to peak in April–May and September, and drop off in late December.
Year-over-Year Growth in Truck Crossings
- 2022→2023: Canada→US truck entries rose +0.6%; Mexico→US rose +1.4%. (Total combined ~1.03% gain.)
- 2023→2024 (prelim., top ports): Canada→US fell ~ –0.5% (top 5 ports); Mexico→US rose +2.8%.
- 2019→2023: Mexico-origin truck crossings up +14.2%; Canada-origin down –2.7%
These figures reflect steady growth on the southern border and stagnation/decline on the northern border in recent years.
Sources: CBP, Land.Media, BTS
Types of Trucks that Enters in the USA
Commercial freight trucks: BTS counts all medium and heavy commercial trucks (tractor-trailers, semis, etc.) entering the U.S. Private vehicles (light pickups, SUVs) are explicitly excluded. Thus “truck crossings” data include everything from five-axle big rigs to smaller box trucks, as long as they are carrying goods. Container trucks are included in these counts (often tracked separately as “truck containers” when counting the containers themselves).
Conclusion
Commercial truck traffic into the United States remains one of the strongest indicators of cross-border trade with Canada and Mexico. In 2023 alone, an average 35000 trucks entered the USA each day.
Seasonal swings, shifting trade agreements, and long-term growth trends show that truck crossings are more than just transportation statistics. Commercial truck activity at U.S. borders is expected to remain a critical lifeline for supply chains and trade flows in the years ahead.
Connecting Industry Knowledge with Proven Services
We provide specialized dispatch solutions to help carriers and owner-operators run efficiently. Explore our key services below: