

by Faizan Hassan
January 10, 2026

Reviewed by Ford
Truck Dispatch Specialist
According to FBI bank crime reports, U.S. armored-car robberies occur at a rate of only a few per year. For example, 2015 saw 26 armored-truck heists. This climbed to 36 in 2016 and 41 in 2017, but then dipped afterward (24 in 2019, 25 in 2020).
After a lull around 2019–2021, incidents began rising again: 31 in 2022 and 43 in 2023. In short, only a few dozen such robberies occur nationwide each year.
Notable spikes occurred in the mid-2010s and again in 2023; overall trends show volatility with no clear long-term upward or downward trajectory.

- Key Statistics: Armored Truck Robberies in the U.S.
- Historical Trends in Armored Truck Robberies
- Regional Distribution of Armored Truck Robberies
- Who Targets Armored Trucks?
- When and Where Armored Truck Robberies Occur
- How Much Money Is Typically Stolen
- Comparison With Other Cash-in-Transit Crimes
- Conclusion
Key Statistics: Armored Truck Robberies in the U.S.
- Annual average: Only 20–45 armored truck robberies occur nationwide each year.
- 2023 total: 43 robberies, the highest level since 2017.
- Lowest recent point: 25 robberies in 2020, during the pandemic period.
- Five-year rebound: Incidents rose from 25 (2020) to 43 (2023).
- Houston, Texas, has led the U.S. in armored truck robberies since at least 2015.
- Chicago, Illinois, saw robberies more than triple in 2023 compared to 2022.
- Urban dominance: Nearly 100% of armored truck robberies occur in urban or suburban areas.
- Timing: Most robberies happen during daytime business hours, especially mid-morning to early afternoon.
- Typical cash stolen: Hundreds of thousands of dollars per robbery.
- Estimated average haul: Approximately $400,000 per incident in many years.
- $18.9 million (1997 Dunbar robbery, Los Angeles)
- $9.8 million (2007 Columbia, South Carolina)
- Recovery rate: Historically, 15% of stolen cash is recovered.
- Violence level: Armored truck robberies are significantly more violent than bank robberies and almost always involve firearms.
- Bank robberies: Thousands per year
- Armored truck robberies: Dozens per year
Historical Trends in Armored Truck Robberies
Armored truck robberies in the United States have remained relatively rare but highly variable in frequency over the past several decades.
While overall crime trends fluctuate annually, federal data shows that armored truck robberies consistently account for a small fraction of total robbery incidents.
Armored Truck Robbery Rates Over Time
FBI data indicate that armored truck robberies peaked during the late 1990s and mid-2010s, followed by periods of decline, including:
| Year | Number of Robberies |
| 1997 | 0 |
| 2010–2014 | 30 annually |
| 2015 | 26 |
| 2016 | 36 |
| 2017 | 41 |
| 2019 | 24 |
| 2020 | 25 |
| 2021 | Low-to-mid 20s |
| 2022 | 31 |
| 2023 | 43 |
Year-Over-Year Changes and Notable Spikes
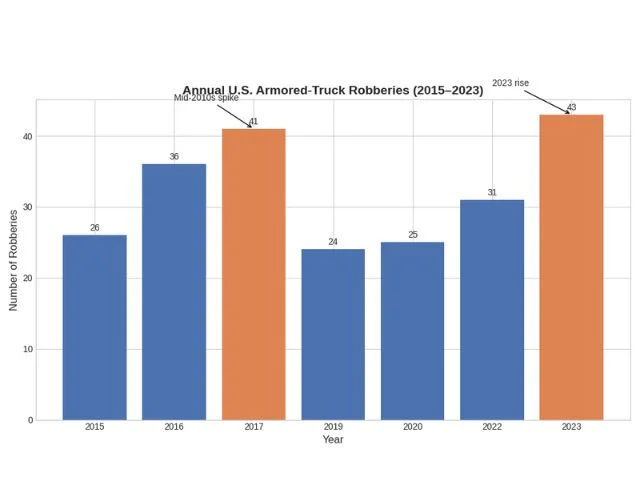
A change of 10–15 incidents in a single year is common, largely because total armored truck robbery volumes are small.
Notable spikes include:
- 2016–2017: A 14% year-over-year increase was linked to repeat offenders and organized crews operating in Texas and the Midwest.
- 2023: A 38% increase over 2022 was driven largely by concentrated activity in major metro areas such as Houston and Chicago.
Key Events That Influenced Robbery Trends
Several structural and societal factors have shaped long-term armored truck robbery trends, including:
- Improved vehicle hardening
- Federal prosecutions
- Urban gun violence trends
- COVID-19 pandemic disruptions (2020–2021)
- Post-pandemic increases in cash circulation
Source: LowerRiskGroup
Regional Distribution of Armored Truck Robberies
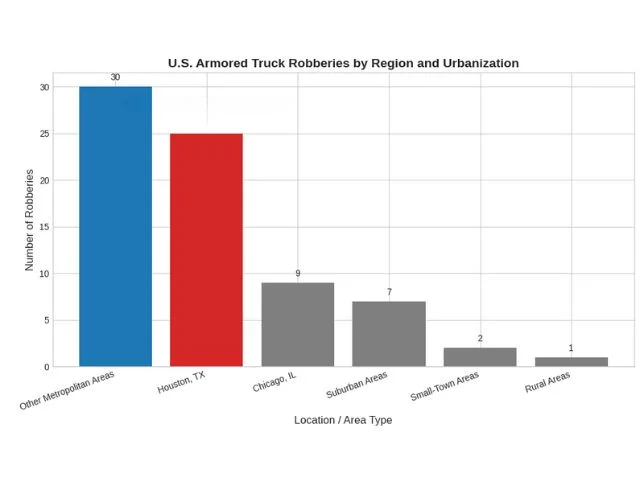
Some U.S. regions see far more armored truck robberies than others. Texas, especially Houston, accounts for the highest number of armored truck robberies.
FBI officials say Houston “has led the nation in armored truck robberies since 2015,” accounting for the vast majority of U.S. incidents.
States With the Highest Number of Armored Truck Robberies
1. Texas (Houston area leads the nation)
- Houston leads the U.S. in armored truck robberies, with a significant portion of the roughly 20–30 annual incidents occurring there.
2. Illinois (Chicago metro spike)
- FBI officials told local media that the 2023 total for Chicago was more than three times the number of armored truck robberies from the previous year.
Urban vs Rural Robbery Patterns
FBI breakdowns show nearly all armored truck robberies occur in metro/suburban areas. For example, the 2018 data list 34 total incidents, all in commercial districts, shopping centers, or metropolitan locales, with zero in rural areas.
Similarly, the 2017 FBI report shows 41 robberies: 30 in “metropolitan” zones, 7 in suburban zones, 2 in small-town zones, and only 1 in rural zones.
Sources: Click2Houston, ABC7Chicago
Who Targets Armored Trucks?
Many armored-truck robberies are carried out by well-organized gangs planning high-value heists. A prime example is the “Choppa City” street gang in Washington, D.C.
Their members conducted three Brink’s armored truck robberies in late 2021–early 2022, stealing over $1.2 million. They stalked driver routes for months and then ambushed the trucks with assault rifles.
This case typifies how experienced criminals use military-style tactics: advanced planning, heavy weaponry, and coordinated attacks.
Source: JusticeGov
When and Where Armored Truck Robberies Occur
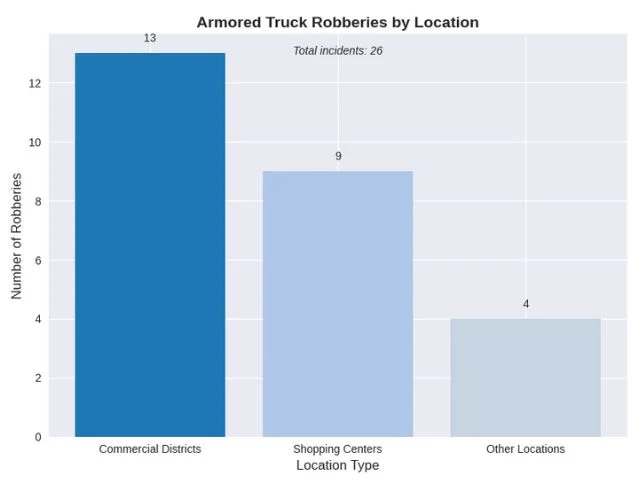
Armored trucks frequently target busy commercial zones. Typical venues include bank parking lots, shopping centers, warehouse districts, and ATMs.
FBI reports break down locations: for example, in 2015, of 26 armored truck robberies, 13 occurred in “commercial districts” and 9 in shopping centers.
Armored truck robberies overwhelmingly occur during daytime business hours. The FBI’s breakdown of hours shows spikes during mid-morning and early afternoon.
How Much Money Is Typically Stolen
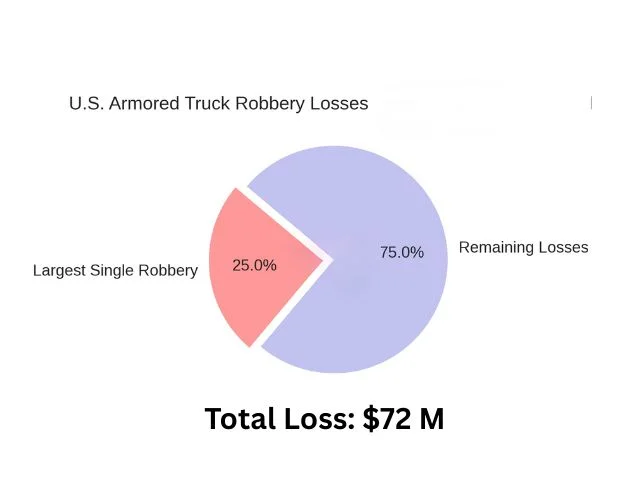
A typical incident nets hundreds of thousands of dollars, though mega-heists can reach tens of millions of dollars. For context, federal reports show that total cash and valuables taken in armored truck robberies can be enormous.
For example, in 2006, U.S. armored trucks had about $72 million stolen across 37 robberies, an average of $1.95M per incident, though that year included at least one $18M robbery.
- Average losses: One analysis of armored truck robberies notes an average haul of around $400,000 in some years.
- High-value outliers: Notable cases include the 1997 Dunbar armored truck robbery ($18.9M) and a 2007 Columbia, South Carolina robbery ($9.8M). For instance, the Choppa City gang took about $1.2M total across three 2021–22 robberies, roughly $400K each.
- Recovery rates: FBI figures for 2006 show only $11.2M returned on $72M stolen (about 15%). In the 2007 Columbia case, $2.7M of $9.8M was recovered.
Source: ABCNews, JusticeGov
Comparison With Other Cash-in-Transit Crimes
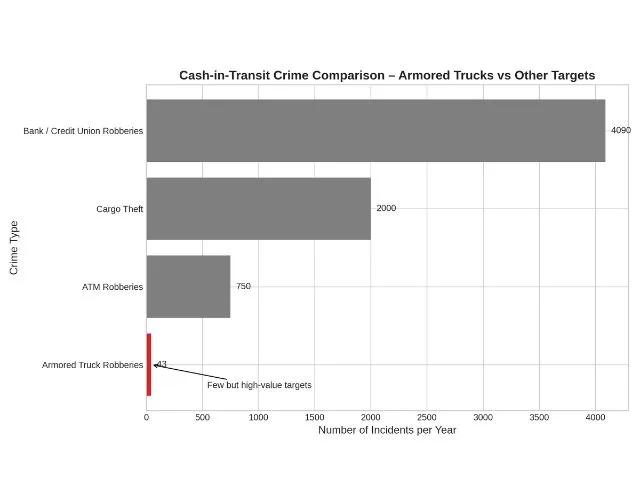
Armored-truck robberies are a small but extreme subset of cash-in-transit crimes, especially when compared to ordinary bank or ATM robberies:
- Bank robberies: U.S. banks see thousands of robberies each year; for example, 2015 had about 4,090 bank/credit union robberies. In contrast, only 26 armored truck robberies happened that year. Even by 2023, the FBI reported just 43 armored truck Hobbs Act violations.
- ATM theft: Thieves also target ATMs (either by break-in, ram-raid, or inside job). Those incidents are more frequent than armored truck robberies but typically yield smaller amounts per incident.
In fact, many ATMs are replenished by armed carriers, making them a secondary cash-in-transit risk.
- ATM robberies: Involving armored carriers, underscoring that any cash pickup is dangerous. However, aggregated losses at ATMs are spread over many more incidents and generally under $100K each.
- Other targets: Compared to cargo theft (trucks full of consumer goods), armored trucks are much rarer targets and exclusively cash-focused. Cash-in-transit covers many forms, but armored trucks are the most protected and thus the toughest prize.
Source: Loomis, LowerRiskGroup
Conclusion
Armored truck robberies remain one of the rarest yet most dangerous forms of cash-in-transit crime in the United States.
While annual incidents typically number only in the dozens nationwide, their impact far outweighs their frequency due to the high levels of violence involved.
Historical data show that these crimes fluctuate sharply year to year. These fluctuations are often driven by the activity of organized crews.