
by Faizan Hassan
January 10, 2026

Reviewed by Ford
Truck Dispatch Specialist
According to the Insurance Research Council (IRC)’s 2023 data, about 15.4% of U.S. motorists were uninsured. This is up from roughly 11–12% in the late 2010s.
By comparison, a 2022 AAA driving survey estimated approximately 255 million licensed drivers, implying that about 14–15% of U.S. motorists were uninsured, which translates to approximately 35–39 million uninsured motorists.
- Key Statistics: Uninsured Drivers in the United States
- What Percentage of US Drivers Are Uninsured? (National Data)
- Historical Growth and Change Over Time
- State-by-State Uninsured Driver Percentages
- Uninsured Drivers by Demographic & Vehicle Factors
- Comparison: How the US Compares to Other Countries
- Conclusion
Key Statistics: Uninsured Drivers in the United States
- 15.4% of U.S. drivers were uninsured in 2023, about 1 in 7 motorists.
- The uninsured rate averaged 11–12% from 2017–2019 before reversing upward.
- The U.S. has 255 million licensed drivers, implying approximately 35–39 million uninsured motorists.
- The largest annual increase occurred in 2020, jumping +2.7 points (11.6% → 14.3%).
- The uninsured rate continued to rise, reaching 14.6% (2021), 15.2% (2022), and 15.4% (2023).
- The highest state uninsured rate reached 28.2%, nearly 2× the national average.
- The lowest state rates fall near 5.7%–6.2%, less than half the U.S. average.
- 82% of uninsured drivers cite cost or vehicle non-use as the reason for lacking coverage.
- Average auto insurance premiums increased 20% from 2022 to 2024, worsening affordability.
- Internationally, the U.S. (15.4%) far exceeds the EU average (1.8%) for uninsured drivers, but remains below India (50%).
What Percentage of US Drivers Are Uninsured? (National Data)
The American Driving Survey estimated that about 255 million licensed drivers were on the road in 2022, so a 14% uninsured rate then implied that roughly 35.7 million drivers were lacking insurance.
How the Percentage Is Calculated
The uninsured-driver percentage is not directly measured by vehicle registrations; instead, researchers estimate this percentage from insurance claim data.
The IRC’s method compares the frequency of claims caused by uninsured at-fault drivers to claims caused by insured drivers.
Insurers aggregate how many bodily injury (BI) claims arose from drivers who turned out to have no liability policy (the “UM claim” frequency) versus those from insured drivers. The ratio of these frequencies yields the estimated uninsured rate.
What group has the highest uninsured rate in the US?
A recent analysis explicitly noted “lower-income drivers are more likely to be uninsured,” underscoring a strong link between affordability and coverage.
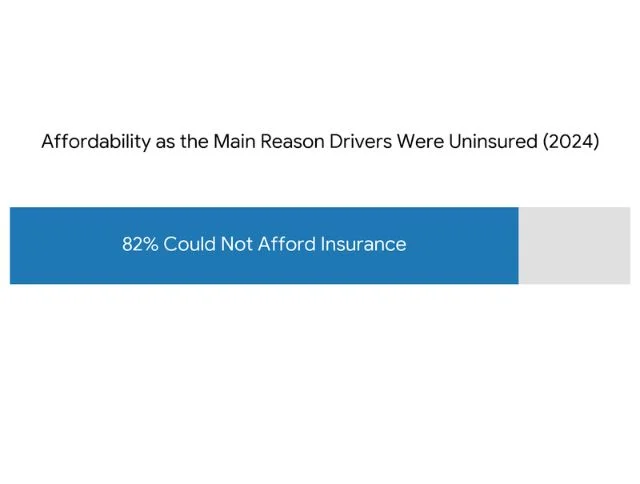
Consistent with this, the vast majority (about 82%) of uninsured drivers report that they either cannot afford insurance or their vehicle is inoperable or unused.
Historical Growth and Change Over Time
Over the past two decades, the U.S. uninsured rate has experienced significant swings.
Uninsured Driver Rates: 2000–Present
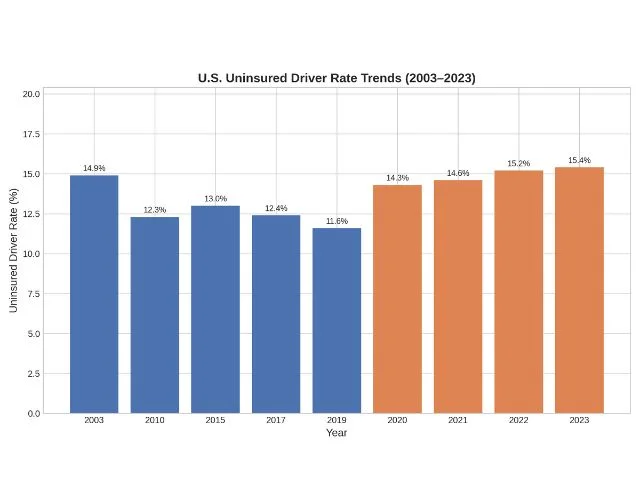
In the early 2000s, the rate was quite high, around 14.9% in 2003. The rate then fell through the 2000s and 2010s. For example, a 2018 study reported an uninsured rate of 12.3% in 2010 (down from 14.9% in 2003) and 13.0% in 2015.
By the late 2010s, the uninsured rate had reached its lowest point in decades: IRC figures put it near 11–12% around 2017.
IRC annual data show uninsured rates of 11.6% in 2019, rising to 14.3% in 2020 (a jump of 2.7 percentage points), then 14.6% in 2021, 15.2% in 2022, and 15.4% in 2023. This is the sharpest climb seen since the early 2000s.
In contrast, from 2017–2019, the uninsured rate had been slowly falling (from 12.4% to 11.6%. Thus, the 2020 pandemic year reversed years of progress, and subsequent years saw continued rises at a slower pace than in 2020.
State-by-State Uninsured Driver Percentages
Uninsured-driver rates vary widely across the U.S., reflecting differences in income levels, insurance affordability, the strength of insurance law enforcement, and state regulations.
What state has the highest rate of uninsured drivers?
Uninsured rates vary dramatically by state. Mississippi has the highest uninsured rate, where 28.2% of drivers are uninsured.
What are the 5 most uninsured states?
The top five jurisdictions (states plus the District of Columbia) in 2023 all had uninsured rates well above the national average.
| Uninsured States | Uninsured Ratio |
| Mississippi | 28.2% |
| New Mexico | 24.1% |
| District of Columbia | 23.1% |
| Michigan | 22.3% |
| Tennessee | 21.3% |
Regional Patterns (South, Midwest, West, Northeast)
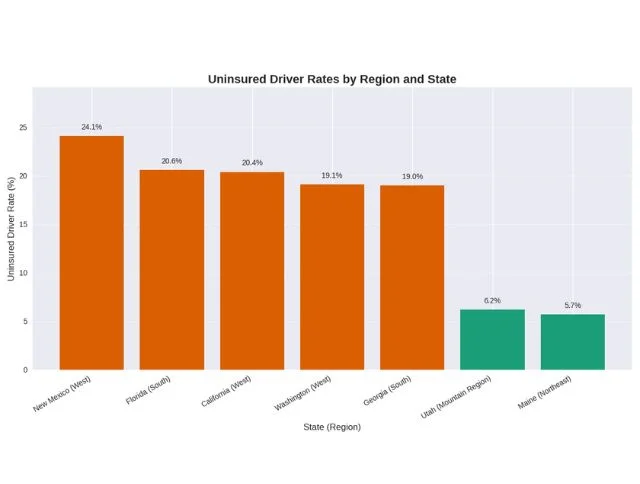
Regional trends are striking. Southern states dominate the high end: Mississippi, Tennessee, and nearby states all rank among the worst. Florida and Georgia (19.0–20.6%) also have high uninsured rates.
In the West, New Mexico (24.1%) and California (20.4%) have high rates, as does Washington (19.1%).
By contrast, the Northeast and some mountain-region states have the lowest uninsured rates. For example, Maine has 5.7% uninsured, and Utah has 6.2%.
Source: III
Uninsured Drivers by Demographic & Vehicle Factors
Some demographic factors are highlighted by authoritative agencies to explain the main reasons behind uninsured drivers.
Income and Insurance Affordability
Income is a major factor contributing to drivers being uninsured. As noted, a study by the Federal Insurance Office found that lower-income drivers are more likely to be uninsured, reflecting affordability issues.
Households struggling to pay rent, health bills, or basic expenses are at higher risk of letting insurance lapse. Industry surveys confirm this: in a 2024 analysis, about 82% of uninsured drivers said they simply could not afford insurance.
Age Groups and Risk Profiles
Younger drivers are generally known to face the highest insurance premiums because of their higher risk profiles, which may push some of them to forgo coverage.
Teenagers and young adults (e.g., ages 16–24) often pay dramatically more for insurance than older drivers. If those premiums exceed their budgets, many young drivers might drive uninsured.
On the other hand, older drivers (retirees) sometimes drop coverage on a rarely used car to save money.
Vehicle Types Most Associated With Uninsured Drivers
Many uninsured motorists drive older, cheaper cars or secondary vehicles that they barely use. In practice, drivers are more likely to skip insurance on a seldom-driven vehicle than on a primary daily driver.
Motorcycles and recreational vehicles may also have higher uninsured rates in some areas.
Sources: HomeTreasuryGov, BankRate
Comparison: How the US Compares to Other Countries
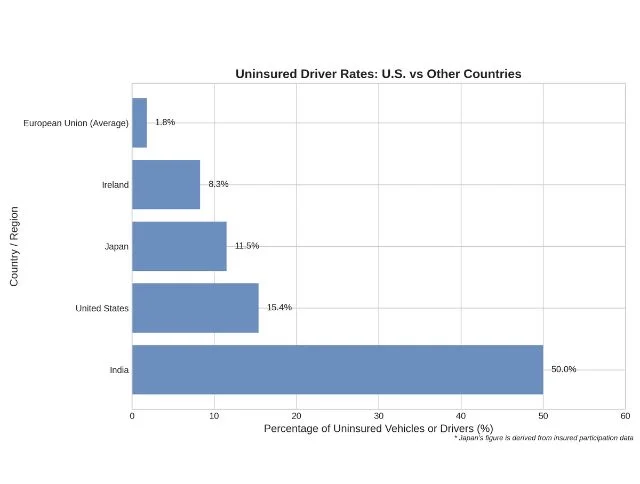
- United States: The latest Insurance Research Council estimate puts the U.S. uninsured-driver rate at 15.4% in 2023 (about one in seven drivers).
- European Union: EU/EEA countries have a very low rate of about 1.8% (most large EU countries are well under 3%). Several EU countries report near-zero or negligible uninsured rates.
- Ireland: By contrast, within Europe, Ireland had a notably higher rate 8.3% of private vehicles uninsured in 2022 (MIBI data).
- Japan: Japan has a compulsory CALI framework, and voluntary coverage participation is high, with 88–89% of drivers opting for top-up coverage according to recent industry statistics.
- India: According to the Economic Times and Indian industry reports, 50% of vehicles in India were uninsured in recent studies.
Why the US Has Higher or Lower Rates
Several factors explain the U.S. situation:
Mandates and Enforcement: The U.S. requires auto insurance in all but one state (New Hampshire, which, in practice, sees low uninsured because costs are high).
However, enforcement varies. Unlike countries that tie insurance to vehicle registration or require proof at renewal, the U.S. often relies on occasional audits and traffic stops.
Affordability and Cost Drivers: U.S. auto insurance premiums have been rising faster than many drivers’ incomes. A 2025 IRC analysis identified rising injury-claim severity, litigation, and the presence of uninsured or underinsured drivers (which drives up costs for insurers) as key reasons premiums are high.
For example, medical bills and legal claims from accidents have grown, pushing the average premium up. Bankrate reports auto insurance costs jumped 20% from 2022 to 2024.
Economic Conditions: The U.S. economy’s ups and downs feed into uninsured rates. The pandemic caused a spike by reducing incomes and job stability. Even before that, the late-2010s saw stagnant wages for many middle- and low-income Americans.
Conclusion
In 2023, estimates indicate that about 15–16% of U.S. drivers are uninsured. This figure has risen sharply in the past few years from 11–12% in 2017–2019 up to 15.4% in 2023.
The calculation is based on insurance-claim data, and it reveals large differences by state and demographic.
Internationally, the U.S. has a higher uninsured-driver rate than most advanced economies (most of which achieve near-universal insurance) but a lower rate than some emerging economies with even higher uninsured levels.