

by Faizan Hassan
March 18, 2026

Reviewed by Ford
Truck Dispatch Specialist
The U.S. trucking and intermodal markets are undergoing a transition from the post-pandemic boom/bust to a more balanced state. After historic freight swings, recent data show freight volumes and capacity stabilizing or modestly shifting.
This report examines metrics on trucking capacity, freight growth, intermodal volumes, regional flows, infrastructure, costs, mode shifts, economic factors, technology, and outlooks.
All data points below are from official industry and government sources, providing accurate figures and percentages.
- Key Statistics: Trucking Shift, Capacity Stabilization & Intermodal
- Trucking Capacity Stabilization Trends
- Freight Market Growth and Demand Indicators
- Intermodal Transportation Growth Data
- Regional Trucking and Intermodal Freight Data
- Intermodal Infrastructure and Logistics Hub Statistics
- Intermodal vs Truckload Cost and Efficiency Comparison
- Economic and Policy Factors Affecting Capacity Stabilization
- Long-Term Trucking and Intermodal Market Outlook
- Conclusion
Key Statistics: Trucking Shift, Capacity Stabilization & Intermodal
- Carrier Capacity: 345,000 carriers (+33% vs 2019); capacity normalized to pre-2018 levels.
- Driver Employment: 505,000 drivers (-3.1% YoY); ~2.2M total drivers; 9,000 lost.
- Freight Volume Trends: 2025 shipments -9.9% YoY; 2024 tonnage 11.27B (-1.2%).
- Truck Market Share: Trucks move 72.7% of U.S. freight; rail holds ~9%.
- E-Commerce Impact: 18% of retail; steady growth supports trucking demand stability.
- Intermodal Volume: 14.06M units (+1.5%); containers 13.65M (+2.4%) dominate.
- Regional Port Volumes: LA/LB 9.45M TEUs; Savannah 4.8M; NY/NJ 6.2M.
- Cross-Border Freight: $1.0T total; Mexico $840B (+5.1%); Canada $761B (-1.6%).
- Truck Orders: 47,000 (Feb 2026, +150% YoY); annual 258,466 (+4%).
- Cost Advantage: Rail 30–40% cheaper; trucks $3–$4/mile; rail 3–4x fuel-efficient.
- Mode Shift Trend: Long-haul (>700 miles) shifting to intermodal; corridor growth +5.5%.
- Outlook: Trucking jobs +4% (2034); intermodal growth 2–4%; infrastructure expanding.
Trucking Capacity Stabilization Trends
Historical Trucking Capacity Fluctuations (2018–2026)
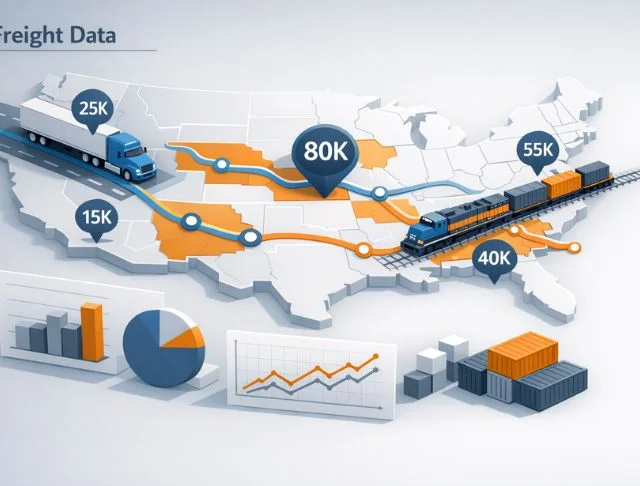
By early 2025, the industry had roughly returned to pre-2018 levels of capacity. FMCSA reports show about 345,000 for-hire motor carriers active in early 2025, 86,000 more (+33%) than in 2019, indicating the surge in new carriers during the boom.
Similarly, long-haul trucking employment (a proxy for capacity) was about 505,000 drivers in March 2025, down 16,000 (-3.1%) from a year earlier and essentially back to early-2018 levels.
In fact, one analysis notes 2025 payrolls were similar to early 2018, meaning the fleet expansion of 2021–22 has largely contracted. These data indicate that the massive capacity overhang of 2021–22 has now moderated, leaving the industry closer to long-term norms.
Year-Over-Year Changes in Truckload Capacity
After double-digit growth in 2020–21, truck tonnage has only nudged upward or fallen slightly. The ATA Truck Tonnage Index rose 0.1% in 2025 over 2024, the first annual increase since 2021.
In contrast, 2024 tonnage (11.27 billion tons) was 1.2% below 2023 levels (11.41 billion tons). These figures show truckload shipments are essentially flat or marginally down, reflecting a stabilization after prior volatility.
Impact of Fleet Expansion and Carrier Exits on Capacity
FMCSA data indicate that by 2025, the number of active carriers was about 33% higher than in 2019. However, despite the increase in active carriers, recent years have seen a net decline in capacity.
In late 2025, the number of for-hire carriers was essentially flat compared with 2024, as revocations nearly balanced new grants.
Federal language rules are also trimming capacity: one DOT count suggests 9,000 drivers were lost due to language proficiency enforcement by the end of 2025.
Sources: TruckingDive, TruckingInfo, FreightWaves
Freight Market Growth and Demand Indicators
Annual Freight Volume Growth in the Trucking Industry
U.S. freight volumes have declined from their pandemic peaks. For all of 2025, national freight shipments (per U.S. Bank’s data) fell 9.9% year-over-year (improving from a −20.4% drop in 2024). ATA data show 2024 truck tonnage at 11.27 billion tons (down 1.2% from 2023’s 11.41 billion tons).
These declines reflect softer demand in manufacturing and retail. Importantly, freight expenditures have not dropped as much; for example, Q4 2025 spending on freight rose 5.2% year-over-year despite volume declines.
Sources: DCVelocity, CCJDigital, GlobalTradeMag
Intermodal Transportation Growth Data

Historical Intermodal Volume Growth in North America
Intermodal rail traffic has grown over the past decade, although it too faced recent slowdowns. In 2024, U.S. Class I railroads reported 13.84 million intermodal units, up 9.3% from 2023, the largest annual gain in years.
By 2025, intermodal continued to expand but more modestly. AAR data show 14.06 million U.S. intermodal shipments in 2025 (containers and trailers), about 1.5% higher than 2024.
In those 2025 totals, container units (most from overseas) were 13.65 million (up 2.4% year-over-year), and domestic trailers totaled 0.41 million.
Rail-Truck Intermodal Market Share Trends
Trucks still dominate freight, but intermodal is growing its share in long-haul moves. In 2024, U.S. freight data attributed 72.7% of domestic tonnage to trucks and only 9% to rail. Rail’s intermodal segment is a bright spot: its 9.3% growth in 2024 shows shippers shifting longer hauls to rail.
Market share changes are slow, but any long-distance commodity with moderate value (like consumer goods, some retail freight, and automotive parts) increasingly moves intermodal.
Growth of Domestic Intermodal vs International Intermodal
In 2025, international intermodal (“containers”) dominated with 13.65 million units, up 2.4%, while domestic intermodal was 0.41 million units, totaling 14.06 million. The larger gain, compared with international intermodal, was in domestic intermodal in Q3 2025, up 2.5% year-over-year.
Most analysts note that ocean container import growth has slowed, so future intermodal growth hinges on both international recovery and domestic freight shifts from trucking.
For now, international loadings remain more than 90% of the intermodal market, but domestic intermodal has been growing as shippers use rail for some cross-border and intra-U.S. moves.
Sources: AARORG, RailwayAge, PortOfLosAngeles, Trains
Regional Trucking and Intermodal Freight Data
West Coast Freight Corridors and Port-Driven Trucking Demand
The U.S. West Coast, anchored by the ports of Los Angeles/Long Beach (LA/LB) and Seattle/Tacoma, is a gateway for huge import volumes. In 2025, the Port of Los Angeles handled record import peaks: July 2025 saw 543,728 TEUs, up 8.5% year-over-year, the busiest month ever.
By year-end 2025, LA reported 9.45 million TEUs year-to-date, up 1% year-over-year, on track for a top-3 annual total. These volumes drive massive truck flows on I-10, I-5, and I-15.
However, late-2025 imports dipped (Nov 2025 LA imports -12% YOY), so West Coast trucking demand has softened from mid-2024 peaks. Major freeway corridors such as I-5 (LA–Seattle) and I-15 (through the Inland Empire) have seen lower truck volumes in recent quarters.
Southern United States Distribution and Truckload Growth
The U.S. South has seen strong warehousing and distribution growth. Southeastern ports like Savannah (GA) and Charleston (SC) have expanded container traffic: Savannah had 4.8 million TEUs through October 2025, up 4% year-over-year.
Inland corridors (I-75, I-85 out of Atlanta; I-20/I-65 through Alabama) carry these loads inland by truck. Intermodal in the South also grew: the “Intra-Southeast” rail corridor (within the Southeast region) increased 8% in Q3 2025, reflecting growth in regional freight.
Northeast Urban Freight Density and Intermodal Usage
Northeast U.S. (from Boston to Philadelphia) has dense freight activity and well-established rail service. Major ports like NY/NJ and urban centers generate high short-haul truck traffic.
Intermodal usage in the Northeast is notable for domestic rail: in Q3 2025, the Northeast–Midwest intermodal corridor grew 5.5% year-over-year.
This suggests robust Chicago–East Coast flows (e.g., through Pittsburgh, Cincinnati). Ports of NY/NJ handled 6.2 million TEUs in 2025.
Cross-Border Freight Between the United States, Canada, and Mexico
Cross-border trucking is a huge component of NAFTA (now USMCA) freight. In 2024, U.S.-Mexico trade by truck reached $840 billion, up 5.1% year-over-year, and U.S.-Canada truck trade was $761 billion, down 1.6% year-over-year.
In total, trucks moved about $1.0 trillion of land-border freight in 2024, roughly 3.6% more than in 2023. Key corridors include I-35 (Laredo border), I-29 (Minneapolis–Winnipeg), and I-75 (Detroit–Toronto).
Sources: BNSF, GAPorts, BTSGOV
Intermodal Infrastructure and Logistics Hub Statistics
Container Terminal Volumes Affecting Trucking Networks
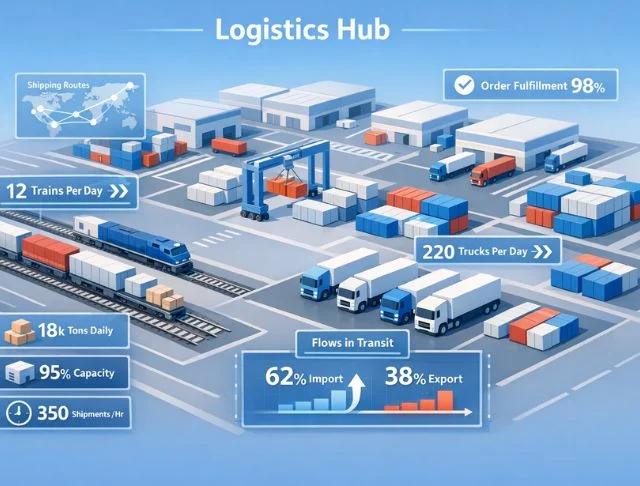
The volume of containers at port terminals directly drives truck demand for drayage and hinterland transport. Key U.S. container ports have seen high but volatile traffic:
- Los Angeles/Long Beach (LA/LB): projected more than 10 million TEUs in 2025 (third-highest ever). July 2025 alone was 543,728 TEUs. The busy port has extensive truck traffic on SR-60, I-710, and other major corridors.
- Savannah (GA): through October 2025 handled 4.80 million TEUs, up 4% year-over-year, a record pace. Savannah connects to inland distribution via I-16 and intermodal connections (e.g., to Charlotte, NC).
- New York/New Jersey: handled 6.2 million TEUs in 2024, flat year-over-year, with extensive rail and truck networks (PATH trains lift containers off trucks).
- Seattle/Tacoma: Pacific Northwest ports saw declines in 2025 (Seattle down 8% for the year), reducing some truck volumes on I-5.
Inland Port Development and Its Role in Freight Diversification
Inland ports (rail-backed distribution centers) are proliferating to relieve coastal congestion. Examples include BNSF’s AllianceTexas (Fort Worth), which already handles a significant share of Texas freight, and CenterPoint Intermodal Center (IL), which opened in 2015 in Chicago.
Georgia Ports Authority’s Blue Ridge Connector near Atlanta is to open in 2026. Blue Ridge will have rail access to Norfolk Southern and is expected to handle up to 60,000 TEUs per year, eliminating up to 52,000 truck trips in its first year and 400,000 at full build.
In Alabama, the $45 million Montgomery Inland Port (ICTF) broke ground in 2023 and will have a 60,000-TEU capacity, connecting central Alabama to Mobile via Norfolk Southern.
Sources: ComptrollerTexasGov, ALPorts
Intermodal vs Truckload Cost and Efficiency Comparison
Cost per Mile Comparison Between Truckload and Intermodal
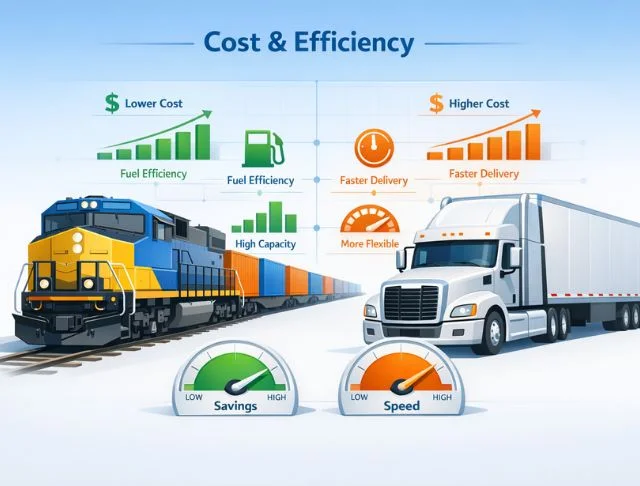
Industry analyses commonly cite rail costs of about $0.03–$0.05 per ton-mile vs truck’s $0.15–$0.20 per ton-mile, roughly a 70% cost advantage for rail. For a 25‑ton load, that translates to $1–$1.50 per mile by rail versus $3.50–$5.00 per mile by truck.
The typical TL linehaul rates today average around $3–$4 per mile (with fuel surcharge), whereas double-stack intermodal rates can be 30–40% lower on similar lanes.
Fuel Efficiency and Emissions Differences
Trains are vastly more fuel- and carbon-efficient than trucks. AAR reports that a freight train can move approximately one ton 500 ton-miles per ton-mile of diesel. Equivalently, rail is 3–4 times more fuel-efficient than trucks.
In terms of greenhouse gas, moving freight by rail cuts CO₂ emissions by roughly 75% per ton-mile compared to road.
Shipment Reliability and Delay Rates
Industry reports indicate Class I freight trains have on-time performance in the 90–95% range, versus 85–90% typical for highway TL (subject to traffic).
In late 2025, BNSF highlighted record-low dwell times and reduced delays, reporting a 14% increase in average train miles per day, reflecting strong service.
Sources: ArtaRail, AarOrg, BNSF
Economic and Policy Factors Affecting Capacity Stabilization
Impact of Fuel Prices on Trucking and Intermodal Demand
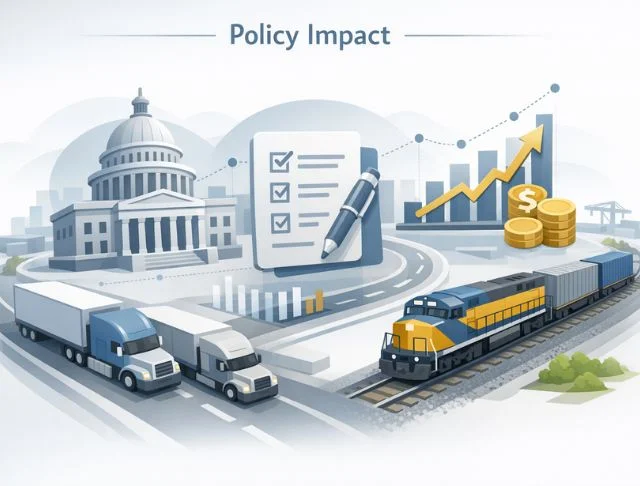
Fortunately for trucking, diesel prices have remained relatively low: ATRI data show U.S. on-highway diesel stayed under $4 per gallon for much of 2024, averaging 13% lower year-over-year.
However, fuel is still a major expense (often 20–30% of total costs). When fuel rises, trucks gain a cost disadvantage versus intermodal (due to rail’s far greater fuel efficiency).
Thus, in years of high diesel (2018–21), there was stronger interest in rail; conversely, 2024’s lower diesel made truck costs relatively more stable.
Government Infrastructure Investments in Rail and Ports
The government allocates $17 billion nationwide for port and intermodal improvements (Port Infrastructure Development Program) and billions more for rail rehabilitation (CRISI, PTC, Grade Crossings).
Specific projects include FRA announcing over $2.4 billion in rail improvement grants across 122 projects in 2023, many targeting intermodal corridors.
States and localities are also pitching in: California, Georgia, Texas, and Illinois have offered incentives for rail yards and inland ports.
Trade Policy and Tariffs Influencing Freight Volumes
In 2024–25, U.S. tariffs (and tariff threats) on imports caused front-loading of cargo. For example, anticipation of Chinese tariffs in early 2025 led shippers to accelerate shipments in late 2024 and early 2025; July 2025 saw record port volumes.
Uncertainty or actual imposition of tariffs (e.g., “Liberation Day” tariffs announced in April 2025) quickly cooled imports, as forecast by Global Port Tracker (projecting 2025 imports slightly below 2024).
Trade policies (U.S. trade agreements, tariffs on specific goods, border regulations) will continue to shape the freight market. Any new tariffs on autos or electronics would quickly show up in rail and truck volumes across border corridors.
Sources: TruckingDive, TruckingInfo, TransportationGov
Long-Term Trucking and Intermodal Market Outlook
Projected Trucking Capacity Trends Over the Next Decade
The U.S. Bureau of Labor Statistics projects heavy truck driver employment will rise about 4% from 2024 to 2034, roughly matching freight demand growth.
Motor carrier counts may shrink slightly as the industry consolidates (post-surge correction), but new fleet purchases and improved productivity (telematics) could enable traffic growth with minimal additional trucks.
Infrastructure Expansion Supporting Intermodal Logistics
- New rail corridors: Texas Central (Houston–Dallas high-speed freight line), fast-tracked.
- Port terminals: The new Virginia International Terminal (Virginia Inland Port expansion) has expanded on-dock facilities for CSX and Norfolk Southern.
- Inland Ports: Include the aforementioned Georgia and Alabama terminals, plus projects in Kansas City and Ohio (Rickenbacker).
- Highway expansions: Highway expansions are underway, including widening I-35 and I-10 freight corridors to connect hinterlands more efficiently to rail hubs.
- Technology/logistics centers: Technology and logistics centers are expanding, with more automated yards and U.S. customs inland clearance facilities. These expansions will enhance intermodal throughput capacity. Over the 2026–2035 decade, they are expected to significantly raise the ceiling for intermodal volumes (a single new intermodal rail line can add 20–30% more container capacity for a region).
Conclusion
The trucking and intermodal freight markets are gradually reaching a more stable balance after years of disruption and rapid change. Companies using multi-modal transport and data-driven planning can better manage capacity changes and build stronger, more efficient supply chains.